Plots > XY Plots > Plotting Data > To Create an Error Plot
  
To Create an Error Plot
1. In a worksheet, insert an XY plot.
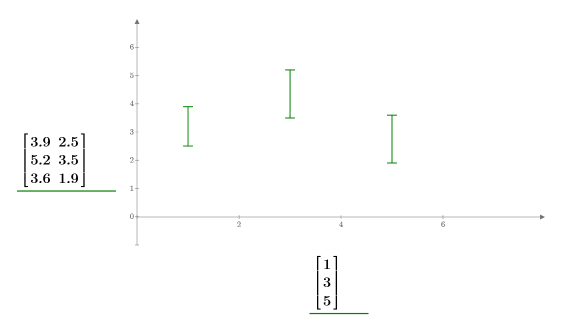
2. To define the multiple traces of the error plot, in the axes placeholders, type the following expressions:
Expression
Description
y-axis
A matrix with two elements per row: the data for the two whiskers of the error bars
x-axis
A column vector of x values
3. Change the trace type to Error Trace. An error plot appears with an error bar for each row of the x and y matrices.