Example: Plotting Large Data Sets Using 3D Plots
1. Define the number of data points to be plotted.
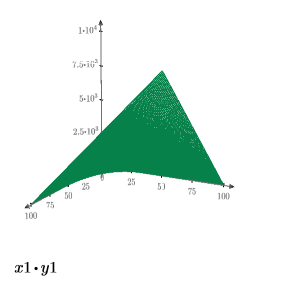
2. Plot the data using a 3D plot.
The number of plotted data points is:
The data points are plotted error free.
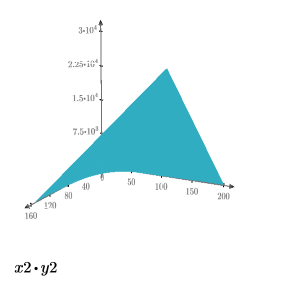
3. Increase the number of data points to be plotted and replot the data.
The number of plotted data points is:
The data points are plotted error free.
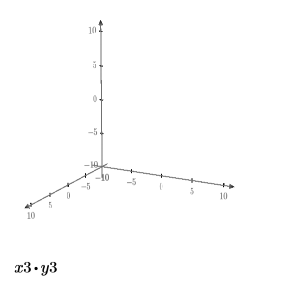
4. Increase the number of data points to be plotted and replot the data.
The number of plotted data points is:
The plot fails because the number of data points exceeds the allowed maximum of 40000.


