Example: Plotting Complex Valued Functions or Data
To plot complex valued functions or data, plot their real and imaginary parts separately. You can also plot the magnitude of the complex numbers.
Complex Valued Data
1. Use the sin function to define a sinusoidal signal.
2. Apply the dft function to the signal.
The resulting DFT vector contains complex and non-complex valued elements with very small scalar values.
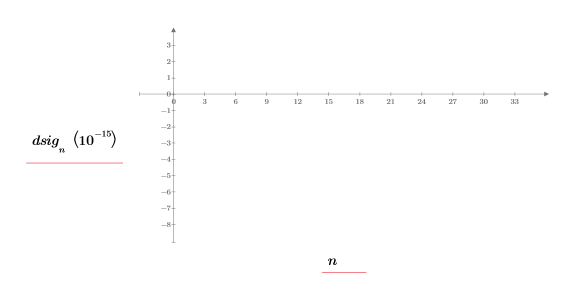
3. Plot the DFT function and scale it by a factor of 10-15.
The plot fails to show any data points.
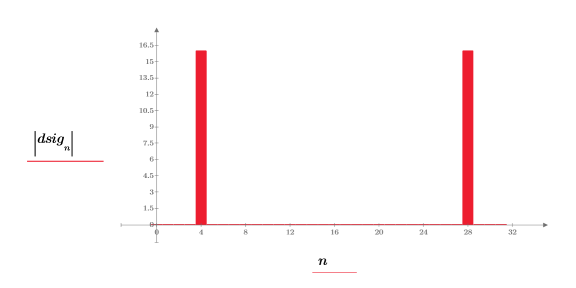
4. Create a column plot of the magnitude of the DFT data set.
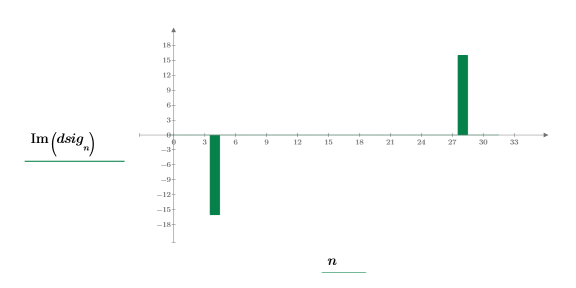
5. Create a column plot of the complex parts of the DFT data set.
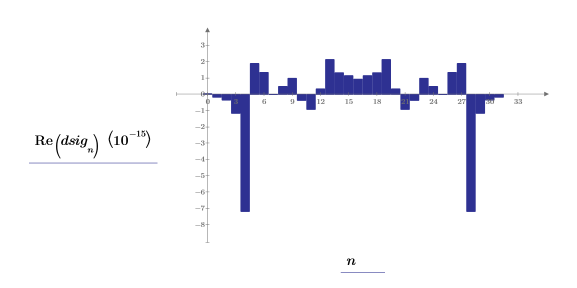
6. Create a column plot of the real parts of the DFT data set.
Complex Valued Function
1. Use the exp function to define a complex exponential function.
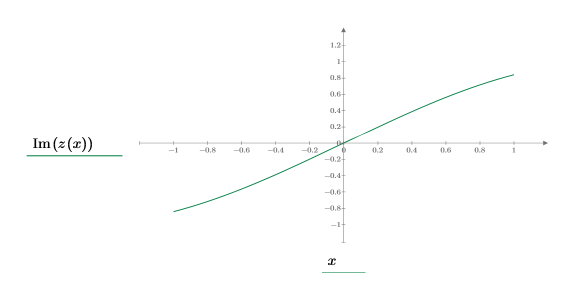
2. Plot the imaginary part of function z.
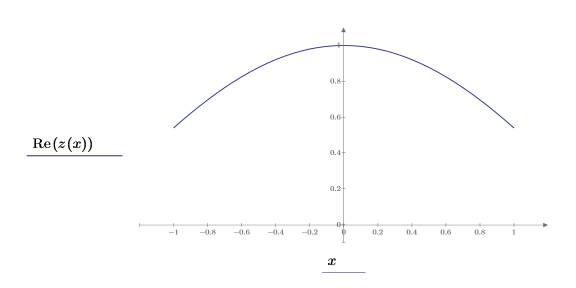
3. Plot the real part of function z.
4. Use the clear function to clear the previous value of x.
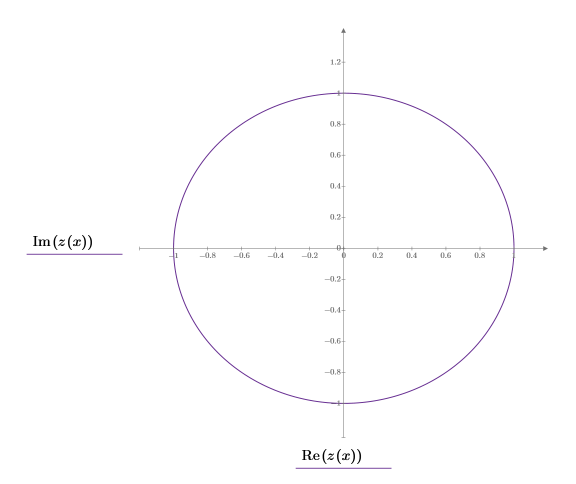
5. Plot the imaginary part against the real part of function z.


