Example: Contour Plots with Singularities
1. Define a 2-variable function with a known singularity.
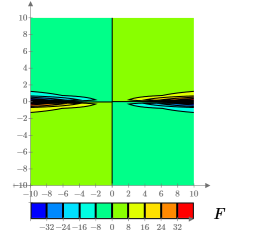
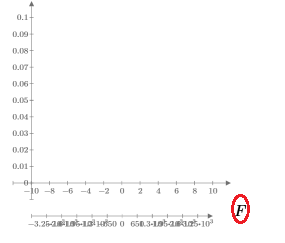
2. Plot F in a contour plot.
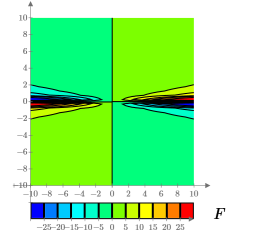
3. Set the z-axis range to -25 to 25:
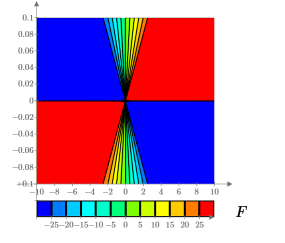
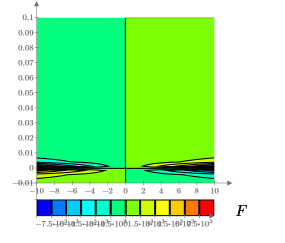
4. Zoom in on the singularity by modifying the y-axis tick marks:
| The red and the blue areas represent regions where the z-axis values fall outside the range of -25 to +25. |
5. Restore the default z-axis values by deleting all its user-defined tick mark values.
6. View the upper-half of the plot by setting the y-axis minimum tick mark to zero.
| The contour plot fails to compute the data because there is a singularity at y=0. |
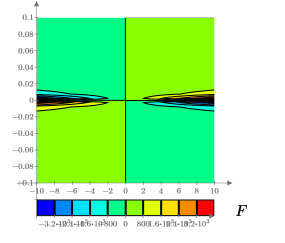
7. Set the y-axis lower tick mark value to a value that is slightly smaller than zero.
The contour plot is now able to compute the data.


